Network analysis
For both The New York Times and Reuters, we construct networks based on collaboration on articles. A node represents an author and a connection between two nodes represents collaboration. The size of the nodes will be scaled by the number of articles an author has published. The networks are undirected and unweighted as the collaborative connection is mutual. With the two networks we will be able to discern the differences in how the two news agencies collaborate between authors.
The New York Times
In the image below the full New York Times graph can be seen.
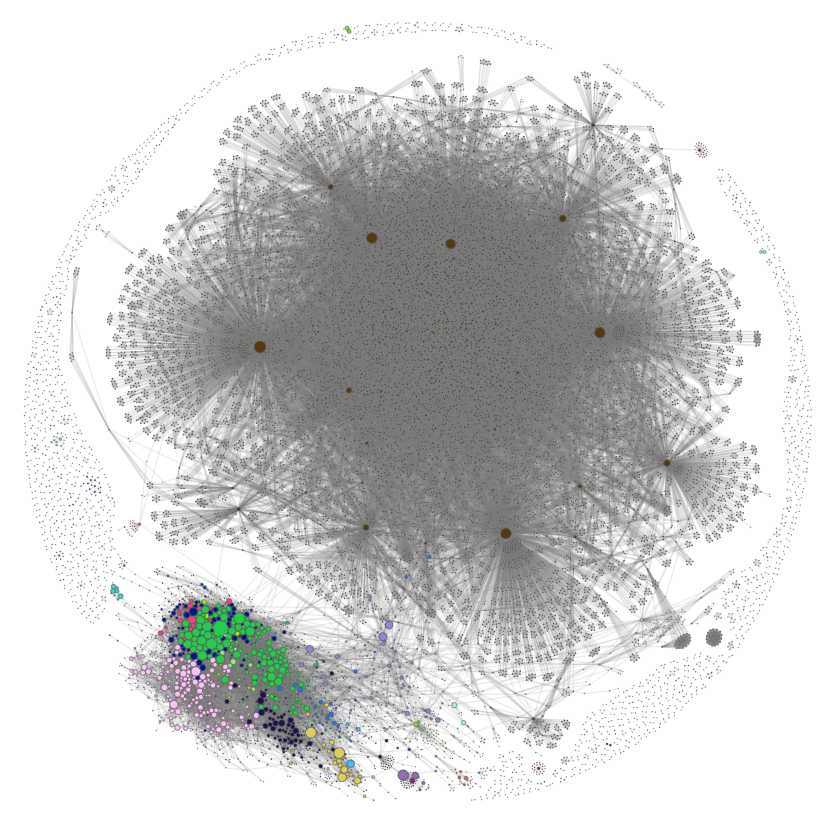
As can be seen there is a large blob in the center of the graph, containing a few authors with a larger number of articles, and a lot of authors with a very small number of articles written, all belonging to the Movies section of the newspaper. Upon further inspection we found that a majority of these “authors” were actually actors, actresses, or other celebrities such as John Cena, Jake Gyllenhaal, Margot Robbie, etc. All of which had a low number of articles, where they were listed as authors, likely due to the fact that they were the subject of the article or were interviewed for the article. As such, we chose to remove all nodes with less than 5 articles written, and the corresponding articles that would result in having a single author or no author are also removed.
The resulting graph of removing the nodes corresponding to authors with 5 or fewer articles written can be seen below.
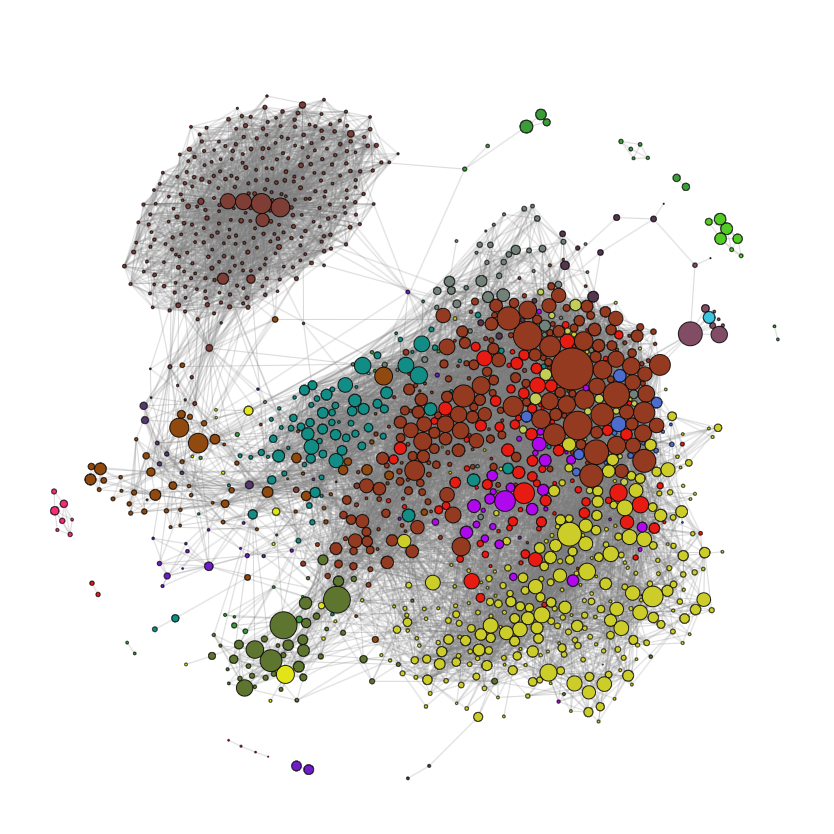
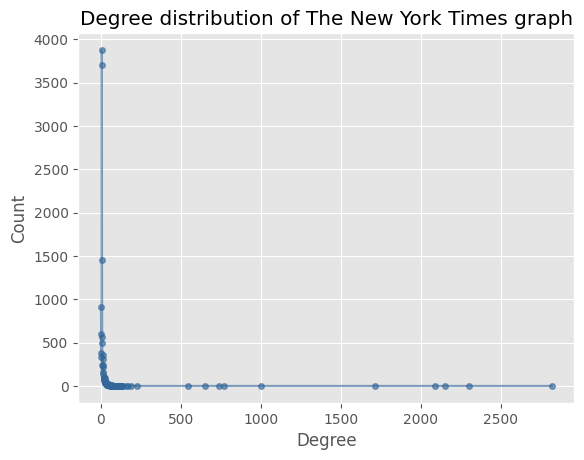
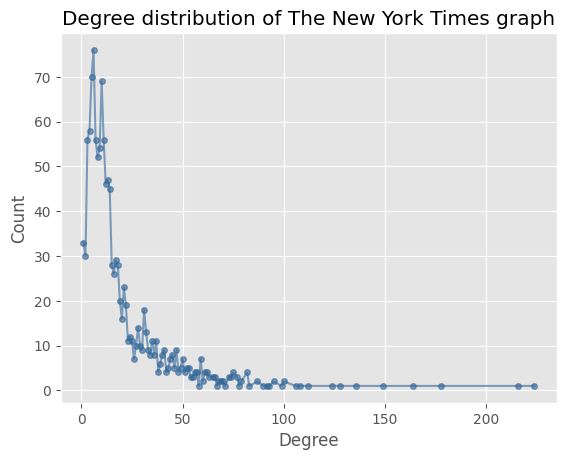
There are some nodes which are disconnected from the main component, and as such will not be able to give much information about the community structure of the graph. We choose to look at the largest connected component, which holds the majority of the nodes in the graph. In the figures below we see the degree distribution of the largest connected component of New York Times graph before and after removing the nodes with less than 5 articles written, we see that some outliers with more than 2.000 links are reduced to a more reasonable number.
| Before | After |
|---|---|
 |  |
Additionally, there are also some network statistics of the largest connected component of the graph before and after removing the unwanted nodes.
| Stat | Before | After |
|---|---|---|
| #Nodes | 15,556 | 1,285 |
| #Edges | 79,857 | 12.731 |
| Avg. degree | 10.26 | 19.81 |
| Median degree | 7 | 12 |
| Avg. clustering coefficient | 0.792 | 0.326 |
We remove a lot of nodes and edges by discarding the nodes with less than 5 articles written, but the average degree of the graph almost doubles. Additionally, the median also increases significantly, which is to be expected as authors with low number of articles written, should have fewer connections. The resulting graph is more densely connected, although the drop in the average clustering coefficient is relatively large
We see that the extremes in the degree distribution are reduced significantly, such as one author having 2.600 links prior to removing the nodes. The clustering coefficient is reduced significantly, this is likely due to the fact that the large blob of nodes has a lot of interconnected nodes, which are removed since a large portion of them have less than 5 articles written.
The largest connected component of the processed New York Times graph can be seen below.
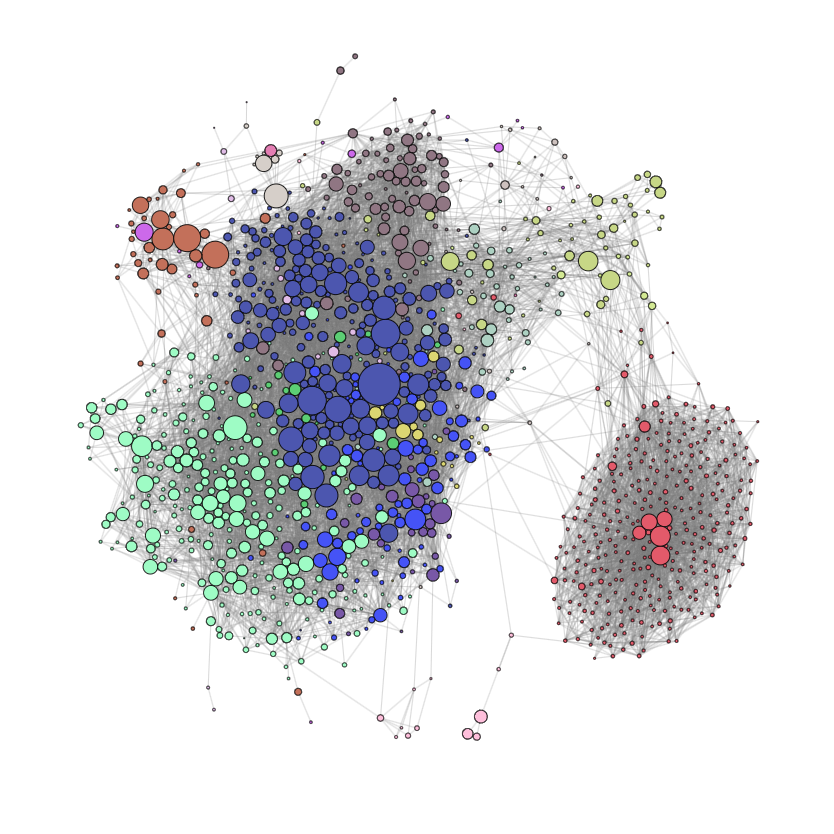

The Louvain community detection algorithm was used on the largest connected component of the graph giving the following partitioning of the graph.
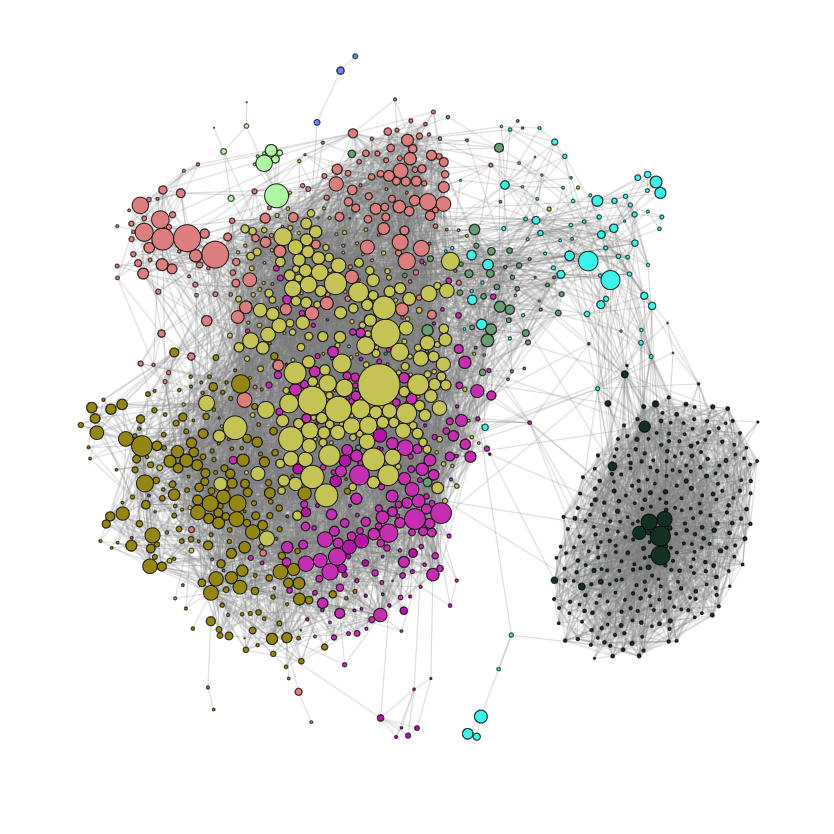
There are some differences between the partitioning given by the authors' most common section and the partitioning given by the Louvain algorithm, but also a lot of similarities.
We computed the modularity of both partitions and performed a randomization experiment to see if the modularity of the partitions are significantly better than a random partition of the graph. The randomization experiment was performed by using the double edge swap algorithm and calculating the modularity of the resulting partition. This was done 500 times, the resulting distribution along with the modularity of the section and Louvain partitions can be seen in the figure below
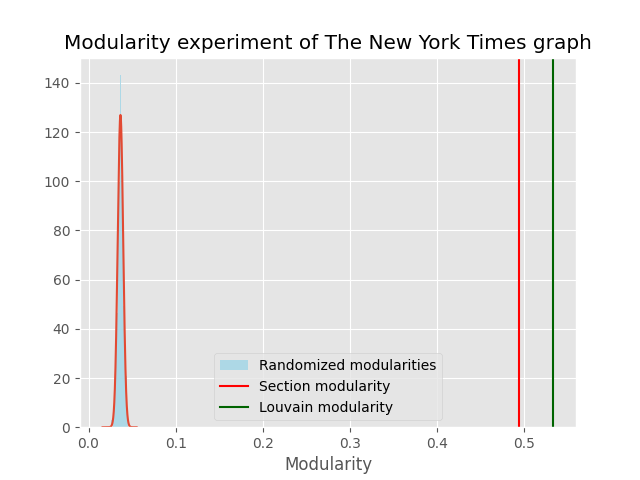
In the table below the modularities from the two partitions and the randomization experiment can be seen for the New York Times graph.
| Section | Louvain | Randomization |
|---|---|---|
| $$0.494$$ | $$0.534$$ | $$\mathcal{N}(0.037, 0.003)$$ |
The modularity of both the section and Louvain partitions are significantly better than a random partition of the graph, with the Louvain partition being slightly better than the section partition.
Reuters
Like with the New York Times graph authors with less than 5 articles written were removed, and articles that would have no or a single author were also removed.
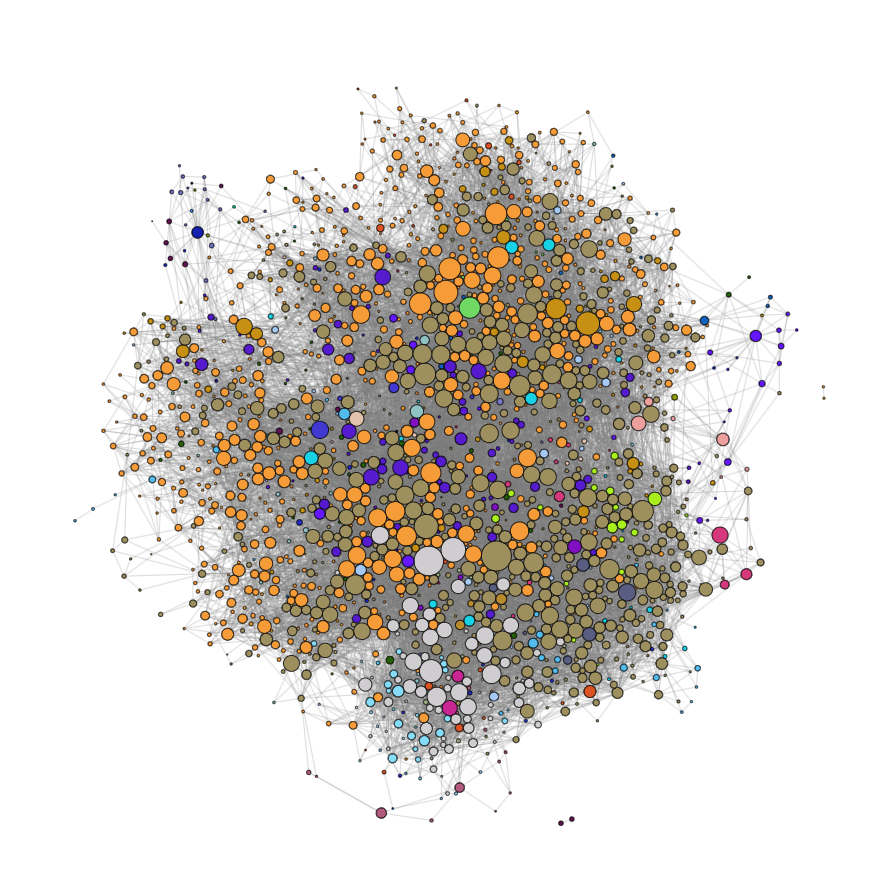
The graph prior to removing any nodes can be seen below, with the nodes scaled based on the number of articles written by the author and colored based on the author’s most published section.
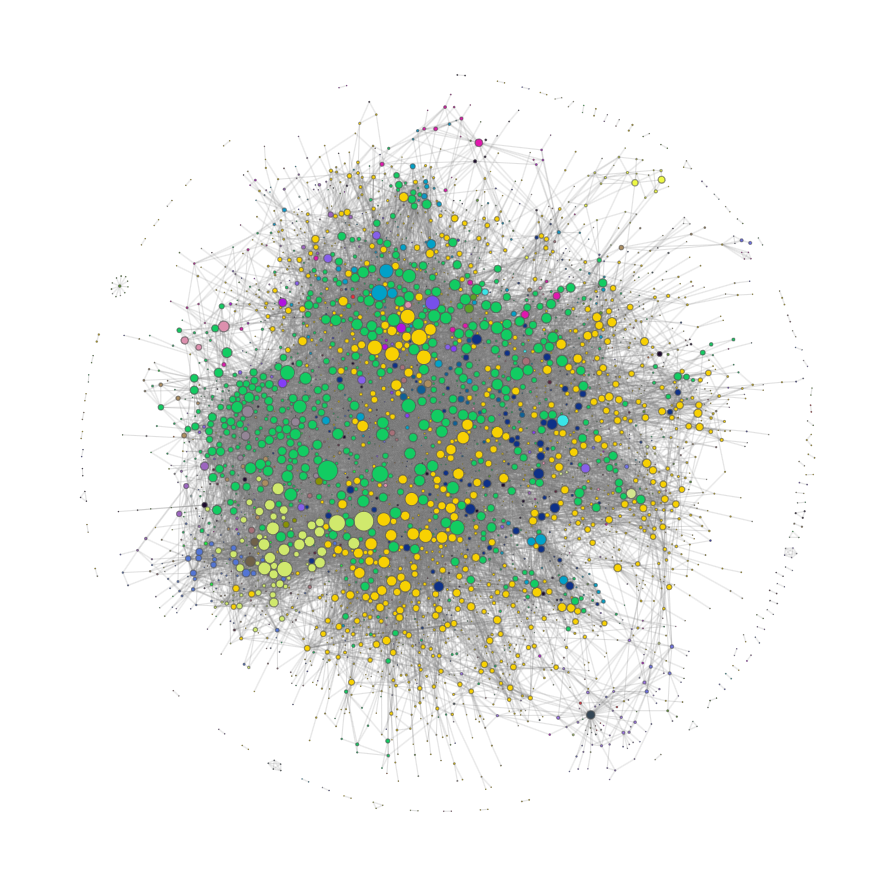
The New York Times graph had a lot of nodes representing non-authors, this was much less of a problem for the Reuters graph, but we still chose to remove the nodes with less than 5 articles written, this was done to remove possible anomalies in the data. The resulting graph can be seen below.
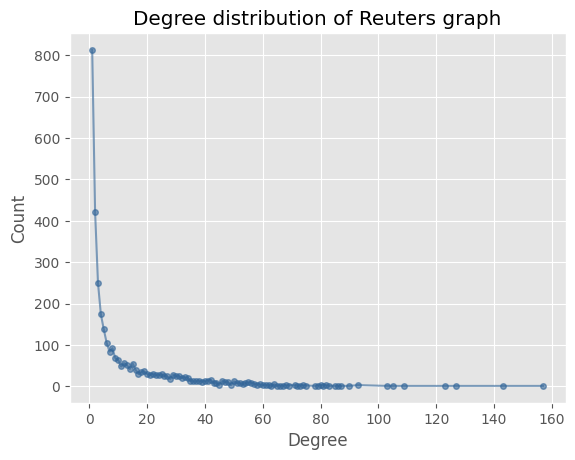
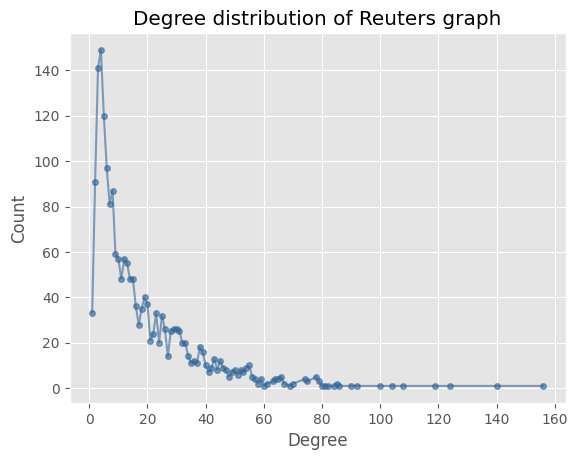
To see the result of removing the nodes we will look at the degree distribution of the largest connected component of the graph before and after removing the nodes. We see no change in the high degree nodes, but the low degree nodes are shifted to the right.
| Before | After |
|---|---|
 |  |
The network statistics of the graph before and after pruning can be seen in the table below.
| Stat | Before | After |
|---|---|---|
| #Nodes | 3,276 | 1,947 |
| #Edges | 19,071 | 17,131 |
| Avg. degree | 11.64 | 17.60 |
| Median degree | 4 | 12 |
| Avg. clustering coefficient | 0.220 | 0.290 |
Both the average degree and median degrees increase significantly after removing the nodes. Which means that the graph is denser.
Once again we chose to look at the largest connected component of the graph, which can be seen below.
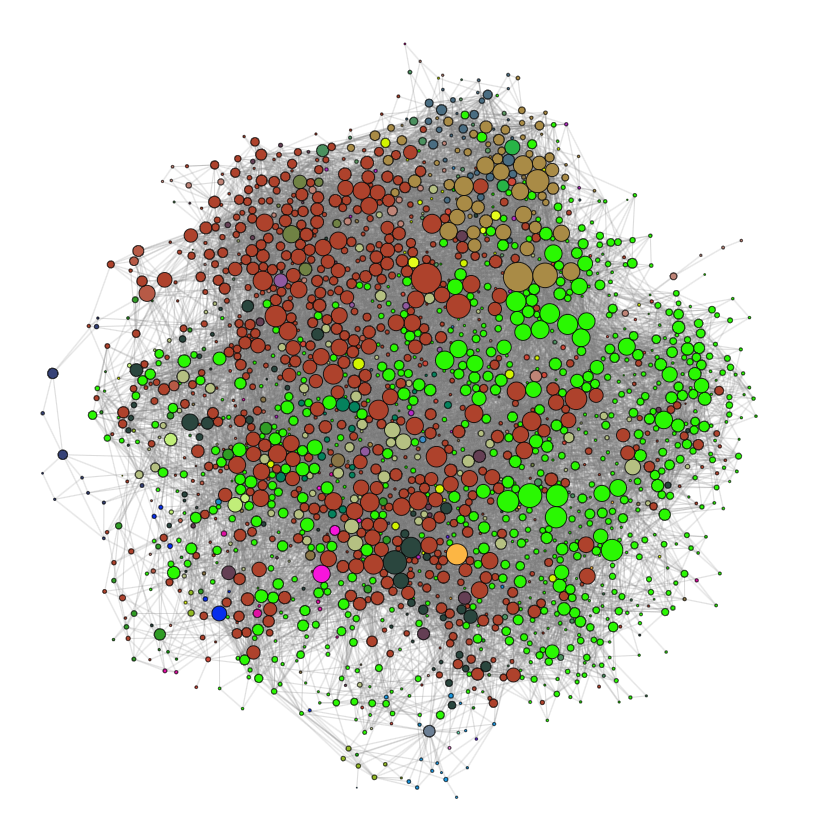

And the partitioning of the largest connected component of the graph given by the Louvain algorithm can be seen below.
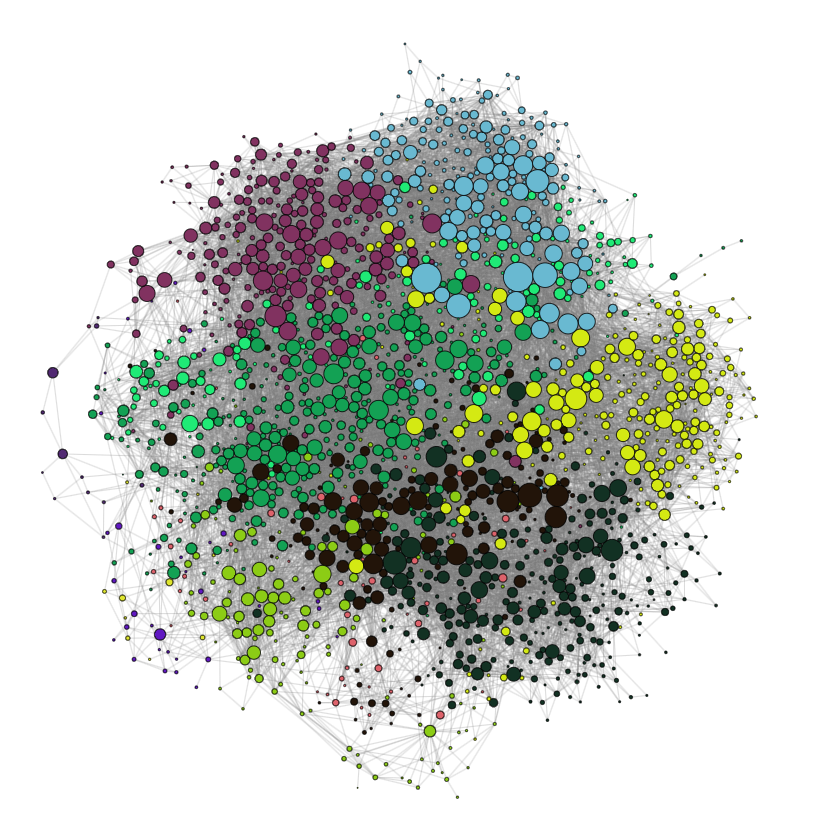
To compare the partitioning given by the Louvain algorithm and the section partitioning the modularity of each partition was computed and a randomization experiment was performed akin to the one performed on the New York Times graph.
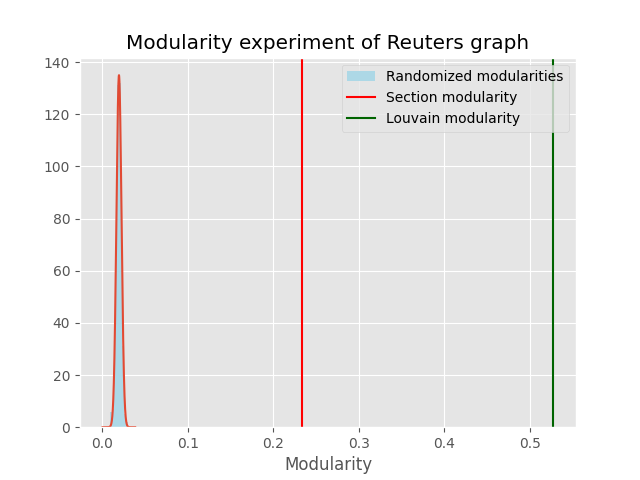
The modularity of the two partitions and the randomization experiment can be seen in the table below.
| Section | Louvain | Randomization |
|---|---|---|
| $$0.233$$ | $$0.528$$ | $$\mathcal{N}(0.020, 0.003)$$ |
As with the New York Times graph the modularity of both partitions are significantly better than that of a random partition of the graph, although the Louvain partition increases the modularity by a much larger margin than the section partition.
Comparison
Comparing the two graphs we see that the modularity of the section partition in the Reuters graph is quite a bit lower than the Louvain partition, whereas the modularity of the section partition in the New York Times graph is much closer to that of the Louvain partition. This could be due to the fact that the collaboration within the New York Times is mostly between authors of the same section, whereas the collaboration within Reuters is more spread out across sections. This is also reaffirmed by computing the degree assortativity coefficient with respect to the section of the authors in each graph. The degree assortativity is 0.333 for the Reuters graph and 0.609 for the New York Times graph, which means the authors in the New York Times graph are more likely to collaborate with authors of the same section than authors in the Reuters graph.
Upon closer inspection of the section partitioning of the section partitioning of both graph we see that, the Reuters graph has 39 sections, whereas the New York Times graph only has 21 sections. This could be due to the fact that the New York Times has fewer more general sections, whereas Reuters sections are less general. We can also look at the number of communities given by the Louvain algorithm for each graph, the New York Times graph is partitioned into 9 communities, and the Reuters graph is partitioned into 11 communities. The number of communities is only half the number of sections in the New York Times graph compared to the Reuters graph, where the number of sections is almost four times the number of communities the Louvain algorithm partitions the graph into.